The axes did not come from nowhere, of course, so we have some guesses about what they do. They were designed with the intent to control perceived mood of background music, with the user of the generative system being able to vary the music's arousal and valence. These somewhat technical terms come from a common two-factor model of moods used in affective-computing research. Arousal represents roughly activity or intensity level of the mood (e.g. calm vs. vigorous), while valence represents the degree to which the mood is positive or negative. These combine to form four quadrants: high-valence, high-arousal moods are exhuberant; low-valence, low-arousal moods are depressive; high-valence, low-arousal moods are contented; and low-valence, high-arousal moods are anxious/frantic.
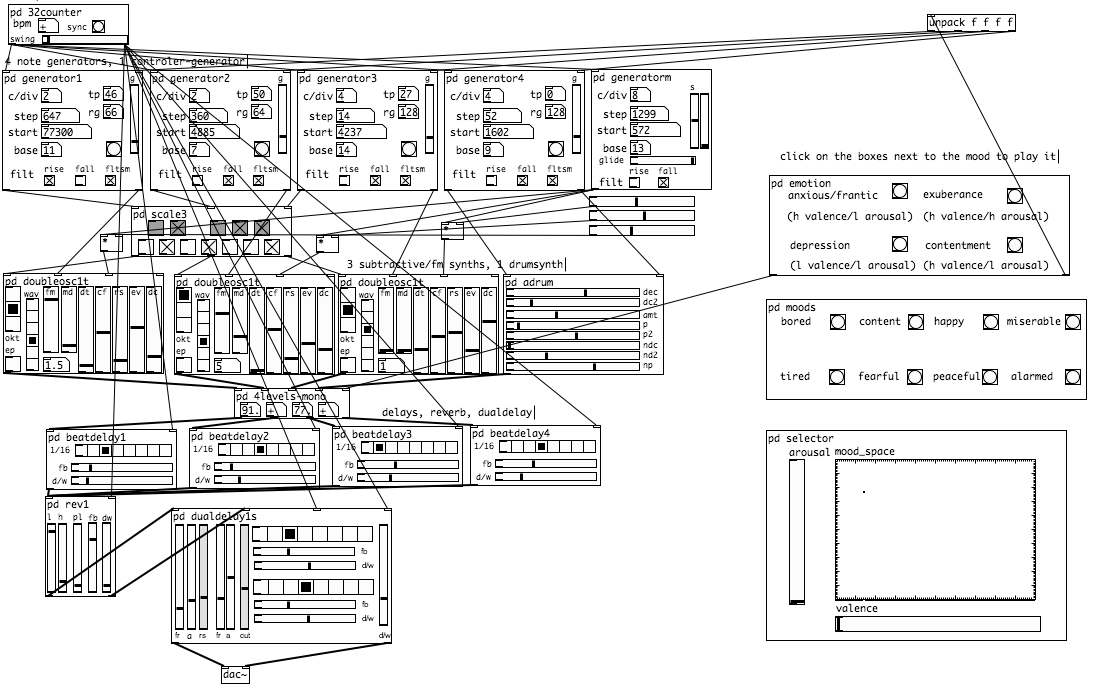
The generator is implemented as a Pure Data (Pd) patch that looks like this (click for a larger version):
The mappings in this generator were designed on the basis of existing theory about the relationship between musical features and mood. Liu, Lu, and Zhang built a system that goes in the other direction: given a piece of music, it guesses what mood listeners will perceive the piece to have, according to the arousal/valence model of mood. It does so by extracting features such as timbre, rhythm, dissonances, etc., and mapping these using a theory of how each of these features relates to arousal and valence. Marco took this mapping and reversed it. So, given a desired point in the arousal/valence space, his generator produces music matching the features that Liu et al. had identified as characteristic of that part of the space.
Some sample clips generated at each of the four extreme settings:
- High-valence, high-arousal:
- High-valence, low-arousal:
- Low-valence, high-arousal:
- Low-valence, low-arousal:
You can also download the generator to play around with it yourself in Pure Data.
Characterizing the generative space
An obvious question to ask at this point is: does it work? Are these axes really controlling perceived mood in the way intended? One way to answer that is a validation study, one that attempts to show that the generators' two axes really do align with the arousal/valence axes of this two-dimensional model of mood. This is hard to do, since there is no ground truth for what the axes "really" are. Nonetheless, it's possible to design a survey instrument that collects listeners' arousal/valence ratings, and analyzes whether they correlate with the intended axes. Marco did carry out such a study previously, with mixed results. This study was to me rather unsatisfying, because the amount of concrete information it gave about the generator was limited: the results were mixed, but not in a way that told us what precisely was going on.
Clearly this music generator does have two axes, which you can drag around to produce different generated music. And that music sure sounds to us like it has different moods. So what are those axes, and how do they interact with perceived mood? To answer that question, we set aside the original goal of designing the axes to be arousal/valence axes, and instead treat the generator as just an unknown music generator parameterized by two unknown parameters. Now the question is not one of validation, but characterization. How do we find out what these axes do, in order to determine whether they offer any interesting and coherent control over mood?
As an aside: sometimes you really do have an unknown axis just fall in your lap, in which case you'd have no choice but to pose the question as one of characterization. In Microsoft's SongSmith, a system for generating harmonic accompaniment for melodies, there are a number of parameters that control how much weight the model puts on different factors, e.g. the chord-to-chord transitions vs. the chord-to-melody alignment. Rather than searching for optimal settings for these parameters, they exposed them as control parameters. In this case, though, the researchers simply invented their own labels (things like "jazz factor") to put on those parameters.
Crowdsourcing a word cloud
We didn't want to attach labels purely based on our own listening, and instead chose to investigate what labels other people might attach. Furthermore, we didn't want to directly ask people to label the axes, but rather to label individual clips, and then deduce from patterns in the clip labels what the axes might be doing. So we decided to start with a very simple, open-ended approach. Listeners were given a clip from a random part of the space, and asked to list one or more words (up to five) describing how the clip's mood felt to them. In order to encourage people to keep going, after each five responses they could compare their answers to some recent answers from other users. The experiment has no pre-defined end: the user is able to continue answering until he/she wants, and can close the online survey at any time.
By putting this online and spreading it to our networks, we collected a total of 2020 free-text labels from 192 distinct users. We can consider patterns in these labels (if any!) to constitute an open-ended, nonparametric characterization of how users perceive the music's mood, as we vary the control parameters. With free-text labels, it is not entirely implausible that there could end up being no easily discernible patterns in the data. Fortunately for us, there do turn out to be some noticeable patterns. Although listeners could in principle respond with any English word or phrase, some words recur often, e.g. "mysterious" was volunteered as a label 34 times. And these do not seem to be randomly distributed either.
To build a "word cloud" style map of the generative space using these volunteered labels, we need to place representative labels in various parts of the two-dimensional space. This produces a map showing, for example, that the label "rushed" appears on average in the high-arousal, high-valence part of the space, while the label "relaxed" is given on average to low-arousal, low-valence clips.
To do so, we calculate the average (mean) arousal and valence of the clips for which each label was volunteered. The average itself is not equally reliable for all labels, however. What we want are well localized labels, where we can place the label somewhere in the space with relatively high confidence.
To determine how well localized a label is, we rank labels by the standard error of their mean location on the arousal/valence axes (standard errors summed over both axes). The standard error of a mean, which is the standard deviation divided by √n, will in general be lower for labels with lower sample standard deviations, and for labels which appear more times in the data set (n is the count of how often the label appears). Note that since we make no assumption about the distribution of data, we can't use the standard error as a basis for a confidence interval, as we could if we assumed a normal distribution. Nonetheless, it is useful as a proxy for how well we can localize a label in the arousal/valence space, relative to other volunteered labels.
Before ranking the labels, we perform two preprocessing steps on the data. First, we stem the words using the Snowball stemmer, in order to aggregate minor part-of-speech variations of labels—for example, this maps both "relaxed" and "relaxing" to the stem "relax". In addition, we exclude labels that appear fewer than 5 times in the data set even after stemming, because the sample standard deviation is an unreliable measure for extremely small n.
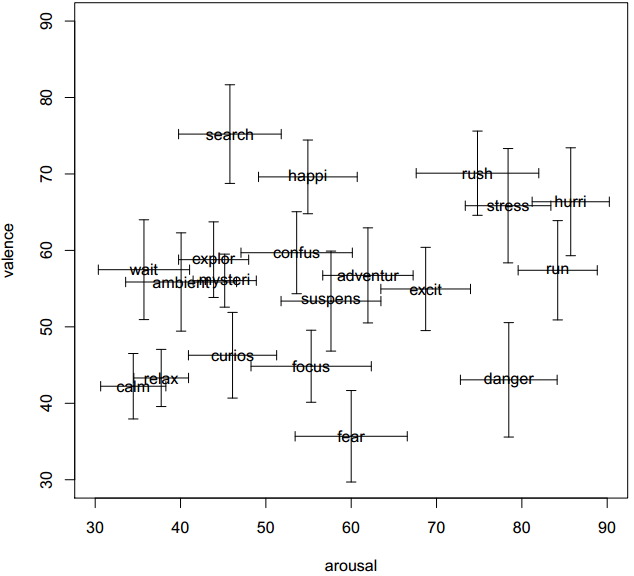
After ranking the labels, plotting the top 20 labels gives us a map of the generative space:
Comparing the map to the theory
This plot alone is surprisingly informative as a characterization of the control parameters' effect on perception of musical moods, more so than we thought it would be.
The axis intended to control arousal seems to map to something like a calm vs. stress axis, which is as expected, except with a mostly negative valence accompanying the high-arousal words. Low-arousal words include (unstemmed): curious, waiting, calm, relaxing, ambient. High-arousal words include: rushed, stressed, hurried, run, dangerous.
The axis intended to control valence, on the other hand, seems to be largely dominated by arousal, but modifies it in a way that has strong interaction effects. Looking at high-valence clips, when coupled with a high arousal setting, they elicit labels that accentuate a feeling of being rushed: rushed, stressed, hurried. So, raising valence, rather than being perceived as positive, instead emphasizes a kind of speed in the context of high arousal, with even a somewhat negative sentiment. Low-valence, high-arousal clips are most often labelled as "danger" instead.
With a mid-level arousal setting, valence does seem to act as a relatively straightforward valence setting: high-valence clips are characterized by "happy", and low-valence clips by "fear". As arousal drops, however, the effect of the "valence" setting becomes particularly inconsistent with its original goal. The nominally low-valence clips, when coupled with low arousal, elicit quite positive labels: calm, relax. As "valence" increases while arousal stays low, the main effect is to get somewhat more active: from "calm" at low valence, to "wait" and "explore" at mid valence, to "search" at high valence settings.
* * *
That is as far as we've currently gone, with the results above written up into a paper. There are a number of further questions. For one, the labels volunteered in this kind of crowdsourcing experiment may be sensitive to different groups' cultural backgrounds and working vocabularies. How would labels differ if we re-ran the study with music students instead of mostly computer-science and game-design students? Or with people from different countries?
This kind of labeling is also only one way to "map" a generative space. Ultimately we would probably like a toolbox of various characterization and visualization techniques. Those can include visualizations of data derived from people interacting with a system, such as here, as well as formal or statistical characteristics of the generative space, such as those visualized by Smith and Whitehead in their "expressive range" diagrams.